Data Accessor
Each captured tag provides a one-click access to its Data Query URL::
One click access (open new Designer instance)
|
|
Just click on the tag type in the first column: AT Internet Data Query Designer is immediately open. |
|
|
|
|
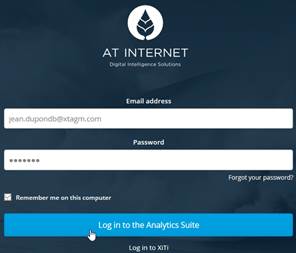
The first time, you’ll be required to enter your credentials. Select “Remember me…” to avoid this step at every browser session.
|
|
|
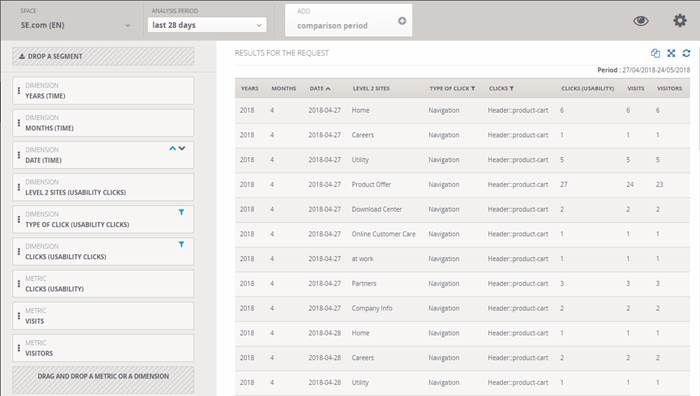
Data Query is automatically loaded and result displayed:
|
|
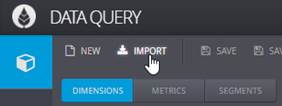
Data Query import (use existing Designer instance)
If the Data Query Designer is already open and you don’t want to open a new instance:
|
|
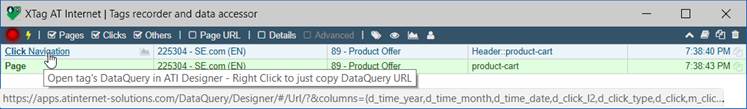
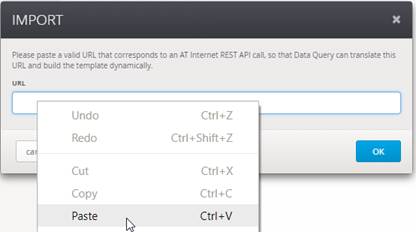
In XTag, instead of Left click, Right click on the tag type to copy
the Data Query URL.
|
|
|
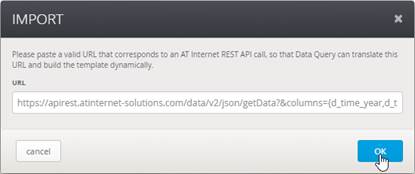
Right click in URL field and select Paste (or Ctrl+V / Command+V), then click on OK
|
|
|
|
|
|
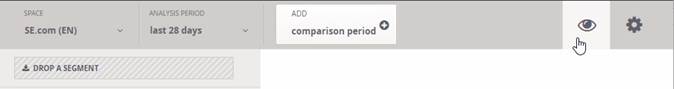
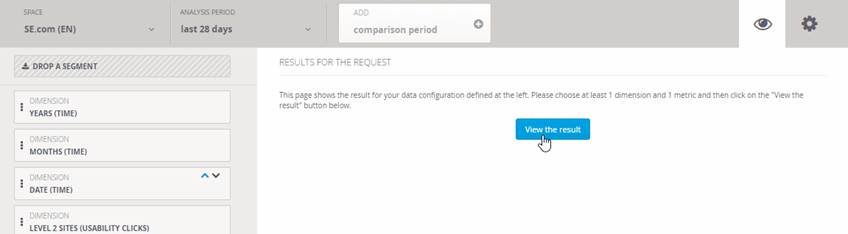
Click on the eye icon on top right,
Then on View the result
|
Other ways to get Data Query
You can also obtain the Data Query URL from individual tag copy or all tags copy, or from in-page CTA Chart / captured CTA Chart data (copied with right click).
In all cases, the Data Query URL is copied in the last column:

|
The Data Query URL obtained from a copied Click tag is not the same than the one used to fill CTA Chart: Click tag provides in more the year, month, level2, visits and visitors, and always sums the last 28 days. For Video tag, it provides in more the full playback count, the playback progress rate an the average playback time, and sums also the last 28 days. For now, only Page, Click, Product and Video tags provide their Data Query URL. Further versions will progressively address all kind of tags. |
Retrieving data in Analyzer NX is a manual process, for which XTag AT Internet provides all inputs allowing to reach the proper figures.
Page tags
|
|
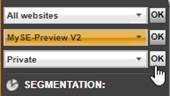
Open Analyzer NX, then select your website
accordingly to the account name you see in the second column
of XTag AT
Internet for this tag.
|
|
|
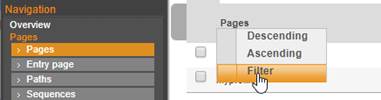
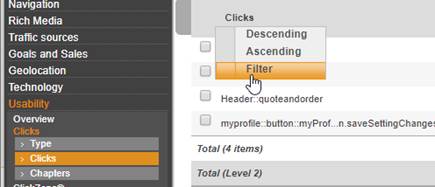
In the menu Navigation, select Pages submenu, then > Pages option, and click on Pages column header: select Filter to display filter options
|
|
|
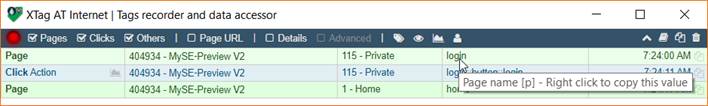
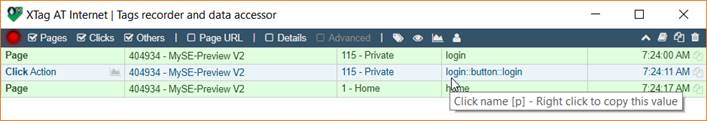
Go to the fourth column of XTag AT Internet (Page name), Right click to copy
|
|
|
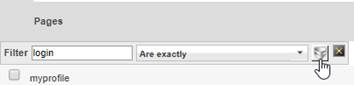
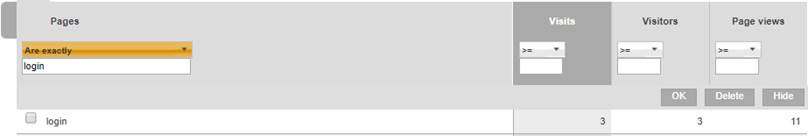
Paste it in Filter area, select “Are exactly” and click on filter icon to validate
Page results are now displayed:
|
|
|
Now you can select the period you want to assess. |
Clicks tags
|
|
Open Analyzer NX, then select your website
accordingly to the account name you see in the second column
of XTag AT
Internet for this tag.
|
|
|
In the menu Usability, select Clicks submenu, then > Clicks option, and click on Clicks column header: select Filter to display filter options
Note: If this is a Download click, you must use menu Navigation, select Downloads submenu, then > Downloads option. |
|
|
Go to the fourth column of XTag AT Internet (Page name), Right click to copy
|
|
|
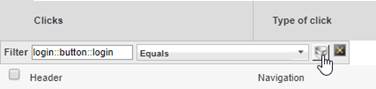
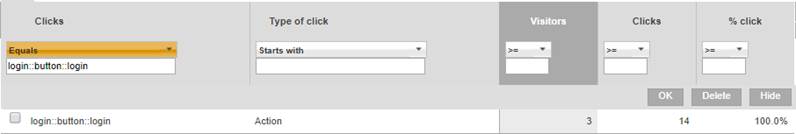
Paste it in Filter area, select “Equal” and click on filter icon to validate
Clicks results are now displayed:
|
|
|
Now you can select the period you want to assess. |
Will be documented soon
Will be documented soon
Will be documented soon