CTA Assessment
![]()
|
As mentioned in tooltip, this feature is proposed in BETA version. |
Scope
All websites marked with XTag Manager or Schneider Electric Tag Manager. No credentials needed.
Usage
|
|
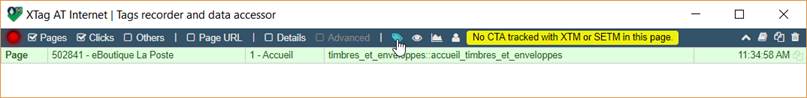
Click on CTA List icon. If current page tracking has not been setup with XTag Manager or Schneider Electric Tag Manager, or if there’s no CTA tracked in current page, a message is displayed:
|
||||||||||||||||||||
|
|
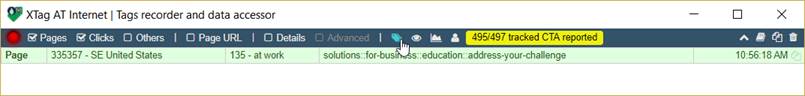
Otherwise, CTA listing is started. Depending on CTA count, it can be immediate or take up to several seconds so that progress is displayed:
|
||||||||||||||||||||
|
|
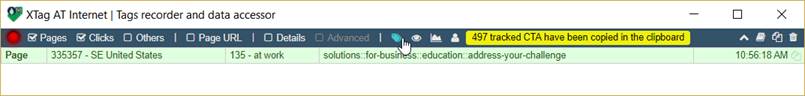
Once achieved, it displays the number of CTA copied in the clipboard:
|
||||||||||||||||||||
|
|
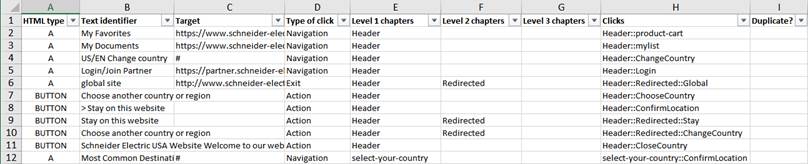
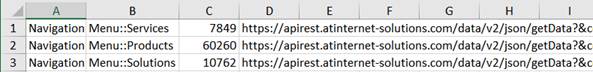
Open Excel -or any tool accepting a tabulated text format- then
Paste (Ctrl+V / Command+V).
|
||||||||||||||||||||
|
|
|
![]()
Scope
All websites marked with XTag Manager or Schneider Electric Tag Manager. No credentials needed.
Usage
|
|
Click on Spy icon, the CTA Spy help message appears on the top left corner of current page (after a couple of seconds, it will be reduced). |
|
|
|
|
|
|
|
Move your mouse in this page over elements you want to assess. When an element is tracked, it will be highlighted, and its click type and name will be immediately displayed. |
|
|
|
|
|
|
|
To stop CTA Spy, click again on Spy icon, or click on help message, or type Esc key. The mode will be stopped as well if you change current tab, if you remove you tab or reload your page or if you navigate to another page. |
|

![]()
Scope
All websites marked with XTag Manager or Schneider Electric Tag Manager. Credentials needed, with granted rights to see concerned website results.
See Data understanding to properly interpret the retrieved figures.
Usage
|
|
Click on Chart icon. If you have not yet entered your credentials, you’ll be requested to do so, see User settings. |
|
||
|
|
If your credentials have been validated, CTA Chart help message appears on the top left corner of current page(after a couple of seconds, it will be reduced). |
|
||
|
|
|
|
||
|
|
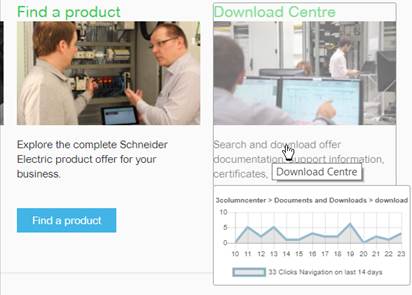
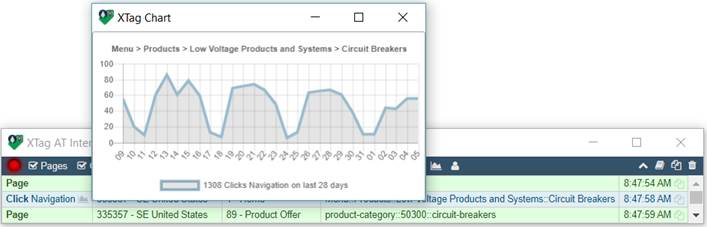
Move your mouse in this page over elements you want to assess. If they are tracked, they will be highlighted, and after a temporization (less than 1s), XTag AT Internet will display a waiting spinner until data will be grabbed. Once data retrieved (it takes in average between 0.5 And 2s), CTA Chart will be displayed for the selected period: |
|
||
|
|
|
|
|
|
|
|
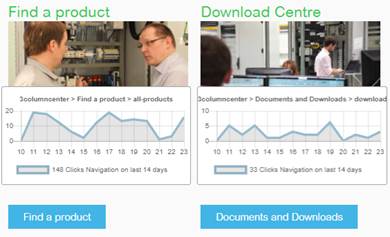
If you want to pin chart on page and/or copy its data, right click where you are (don’t try to do it in chart, it would disappear), or type + key. |
|
||
|
|
|
|
|
|

|
|
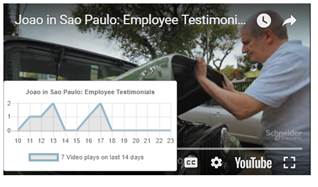
Videos “started plays” can be retrieved too, but to do so, you must play the video at least one second. |
|||
|
|
|
|
|
|
|
|
|
|
|
|
|
|
To stop CTA Chart, click again on Chart icon, or click on help message, or type Esc key. The mode will be stopped as well if you change current tab, if you remove you tab or reload your page or if you navigate to another page. |
|||

|
Pinned Charts will stay in page after Chart mode disabling, and even if XTag AT Internet is closed. But they will be lost if you navigate to another page, or if you reload the current one. |
Scope
All websites, whatever the way they have been marked. Credentials needed, with granted rights to see concerned website results.
Data must be interpreted the same than In-Page CTA Chart (see Data understanding).
Usage
|
|
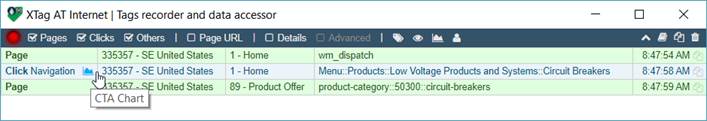
Click on grayed Chart icon of any captured tag displaying it. |
|
|
|
|
|
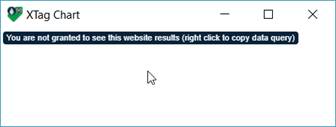
If you have not yet entered your credentials, you’ll be requested to do so, see User settings. If you have entered them, but you are not granted to see the website results, you’ll be warned, but you’ll still have the possibility to copy the corresponding Data Query with a right click:
|
|
|
If you are granted, the corresponding Chart is immediately displayed as a new window:
|
|
|
With a right click on Chart, its data summary is copied in the clipboard (type, name, total, Data Query). |
|
It will be up to you to manage and close the chart windows created this way. It will remain until you’ll close it, even if XTag AT Internet is closed before. |
Definitions
There are 2 types of clicks statistics:
Global clicks: Click statistics measure a feature globally, not for a specific page.
Sample: "how many clicks on My products?"
Specific clicks: Click statistics measure a specific click in a specific page (CTA)
Sample: "how many clicks in the banner for life is on page?"
Global clicks on Schneider Electric countries
Header & Menu
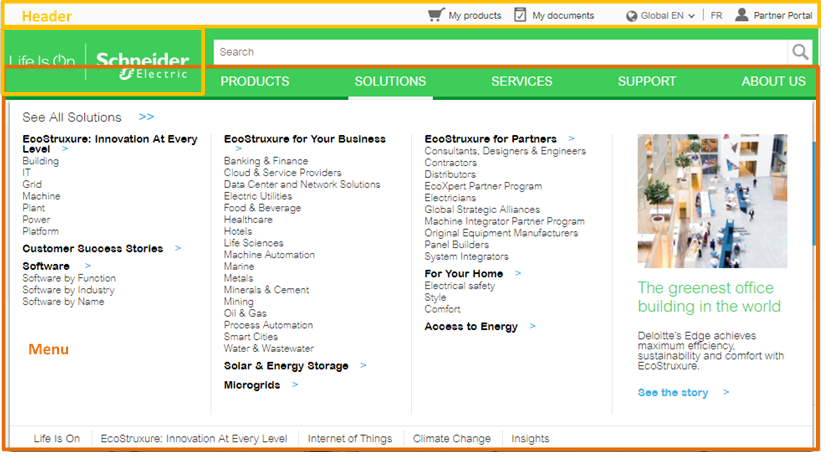
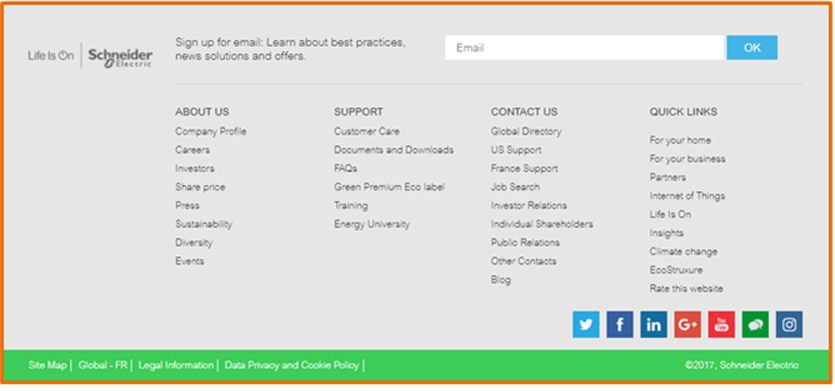
Footer
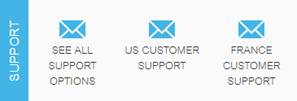
Sticky bar
Social sharing bar