Assessments
Common CTA
A Common CTA is a click action recorded with the same name in all Sites of the selected Sites Group.
Let’s take as example the Support bar usage:
1. Run XTag AT Internet
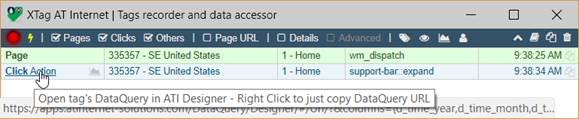
2. Load one
page where this CTA is present, click on it to capture its tag:

3. Click on
captured tag to open it in ATI Data Query Designer:
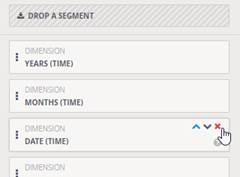
4. Remove the
DATE
(TIME) dimension to reduce the granularity to month,
then copy the resulting Data Query URL:
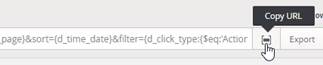
Go back to XTractor, Paste it directly in Data Query
column:
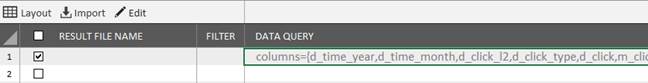
5. Enter a
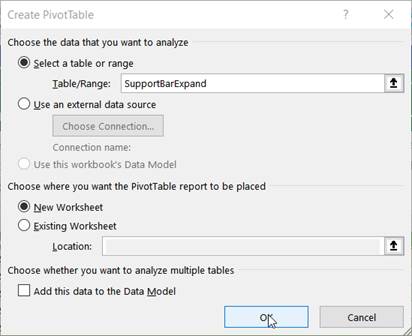
name for Result File:
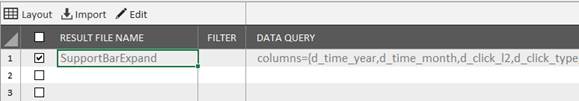
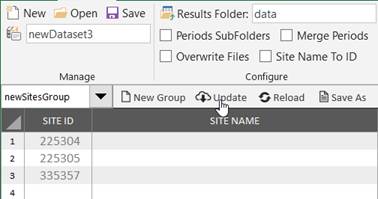
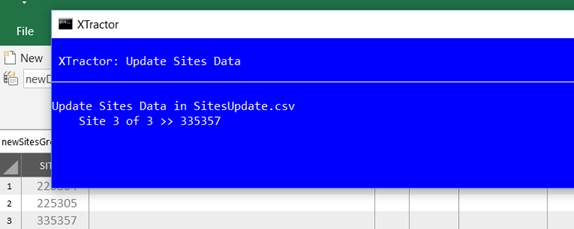
6. Select a Sites Group. If there still none created, enter a list of Site IDs, then click on Update.
![]()
![]()
7. Click on Save As and give this group a name
8. Add at least one Period
9. Set the Dataset name
10. Run XTractor.
11. Once measurement done, click on Open Results Files, and select the corresponding file name
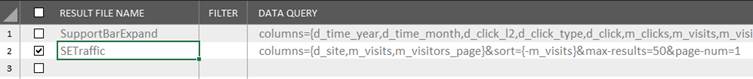
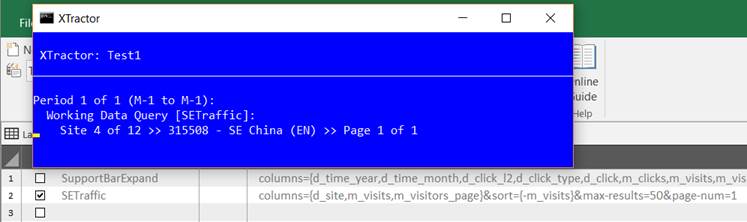
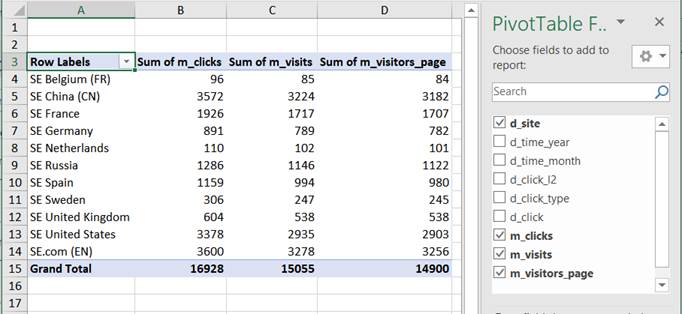
Global Traffic
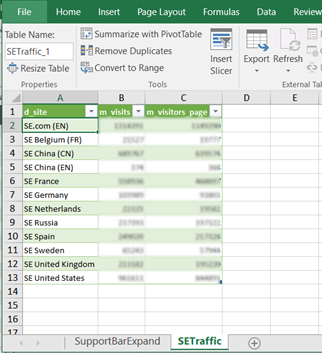
To consider a CTA usage regarding the global traffic (visits and/or visitors) for the assessed period(s), another query must be added without any time dimension, so that it will retrieve only one row per Site:
Import it in XTractor, set its name as “SETraffic” for example, then select it and unselect the previous, to not run it again:
![]()
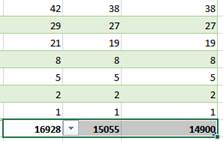
Auto Sum
Select a cell in a metric column, then [Ctrl] + Down arrow to go to the last row.
Select the cell just below. You can also select all metric cells.
Click on
Home tab command
AutoSum:
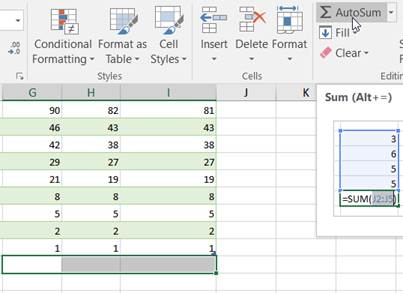
It
automatically sums selected columns without entering any
formula:
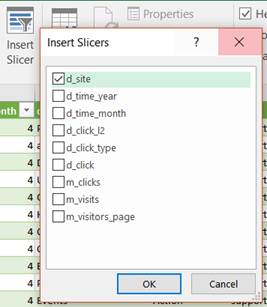
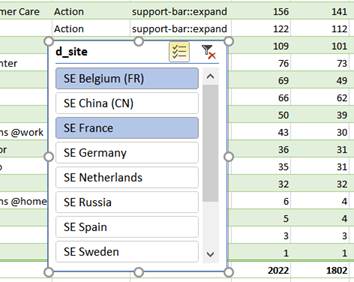
Slicer
To filter by
Sites Name, click on Table Tools Design tab command
Insert Slicer:
Once done, you can select one or several countries (click on multi-select first): if AutoSum has been activated has previously described, you’ll immediately see the corresponding subtotal:
|
Slicers offer the same selection ability than header filters checkboxes, it’s just quicker to select/unselect. |
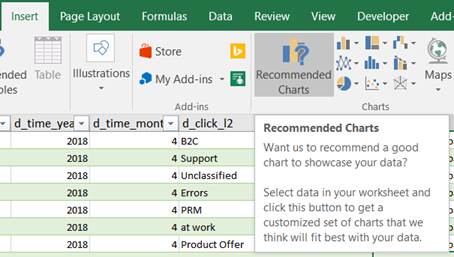
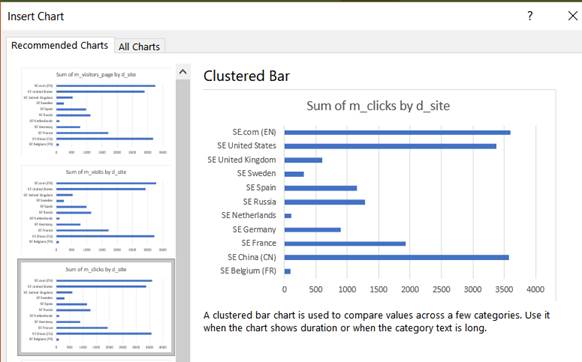
Instant charts
Click on Insert tab command Recommended Charts:
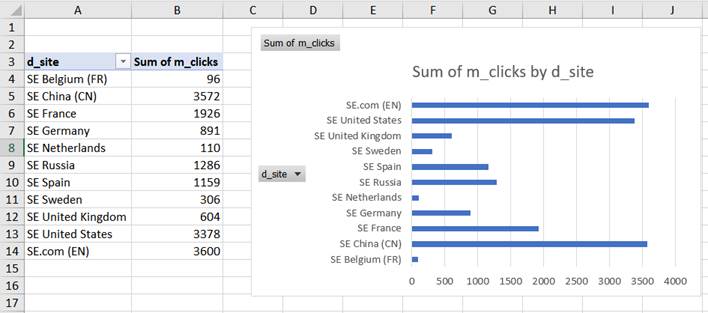
Pivot Table
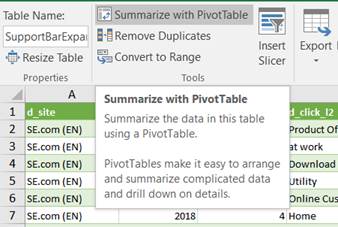
Instant charts above automatically create Pivot Tables. You can also choose to create a complete one by clicking on Table Tools Design tab command Summarize with Pivot Table:

Tables Relationships
In example above, visits and visitors are retrieved, but only those with at least one considered click during the visit.
If we really want to assess the usability of the feature in the considered period, we must relate this measure to the global traffic:
1. Click on Open
Results Files, then open the Global Traffic (SETraffic) previously
measured: now you have two tables in your results workbook (open
the previous one too if not already done):
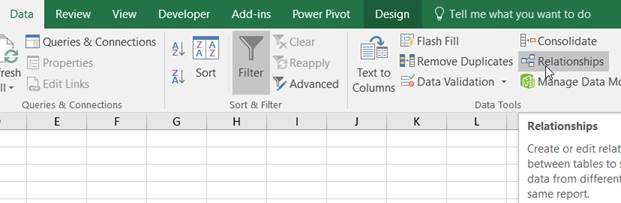
2. In Data tab, click on Relationships:
3. Click on New, then use
d_site as Column:
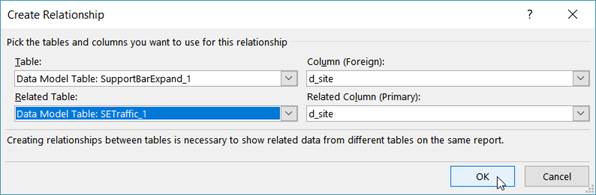
4. Click on [ OK ], then on [ Close ].
5. Now, click on Table Tools Design tab command
Summarize with Pivot Table:
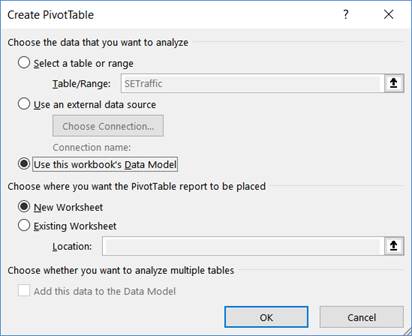
6. Select Use this workbook’s Data Model then
[ OK ]
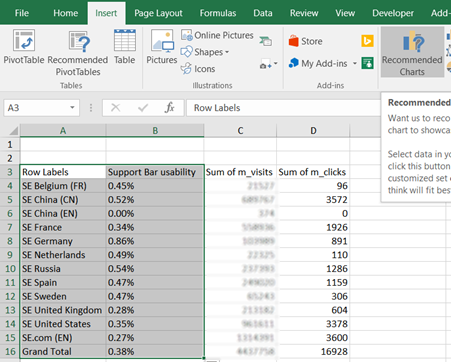
7. Select d_site, m_visits (and/or m_visitors_page), and m_clicks:
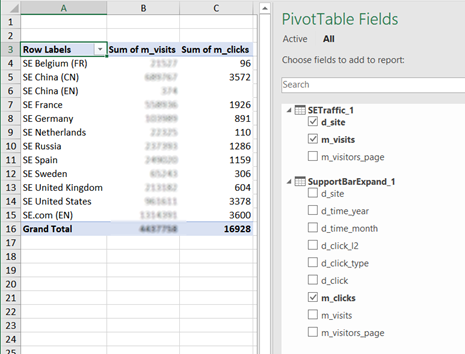
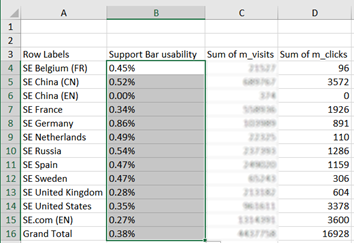
Calculated Fields
Now that we’ve got both global traffic and CTA usage linked, we can easily calculate a ratio number of clicks / number of visits (or visitors).
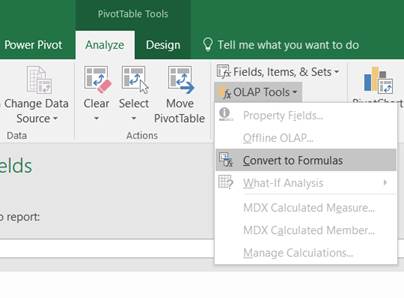
1. Still in
Pivot table worksheet, from Pivot Table Tools Analyze
tab, click on OLAP Tools menu, then on
Convert to Formulas:
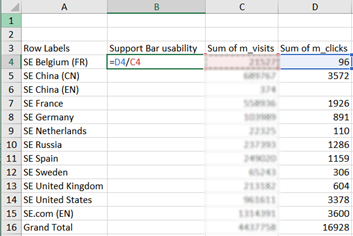
2. Now the
Pivot Table is a list of values: insert a column in first position,
give it a name then enter a formula to calculate the ratio
clicks/visits:
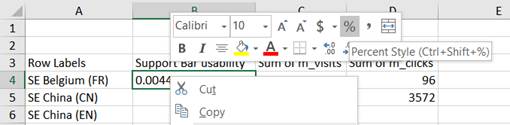
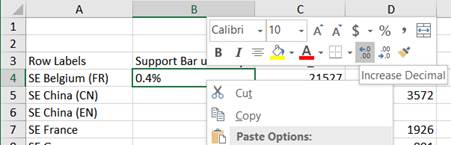
Type 0 in empty cells, format the cell as percentage (right
click, % icon), increase
decimals (right click, icon 0 0.00) two times,
then extend cell’s format to whole column by dragging its lower
right corner:
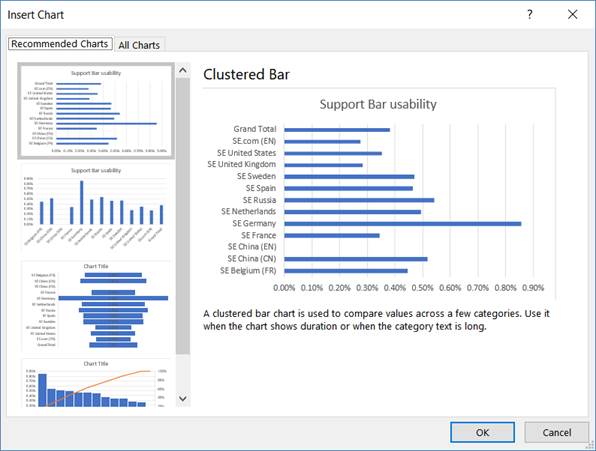
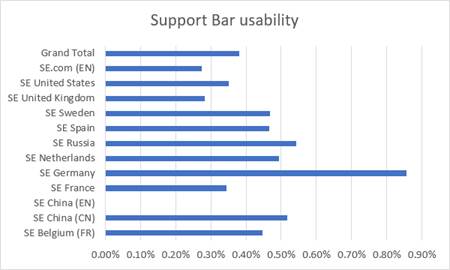
3. Now select
Labels and ratio columns, then from Insert tab, click on Recommended Charts and select the
first: